
Netflix is synonymous with streaming, and the latest Netflix statistics proved this right. The reason why Netflix is growing exponentially is its original content, releasing 700+ titles annually, including movies, documentaries, series, and more.
Netflix surpassed 325 million paid subscribers globally in April 2026, which is a significant jump from 300 million in 2025. Apart from that, the ad revenue has doubled from last year and is expected to keep growing this year, too.
Such data is just the tip of the iceberg. If you want to know more about Netflix’s success, here are the latest statistics and insights for 2026.
Here are key takeaways, followed by the transcript of their Q4 2025 report below:
- The predicted revenue growth of 12% to 14%.
- Netflix is planning to work with Greta Gerwig on a new Narnia movie in late 2026.
- Co-CEO Sarandos recently talked about the strategy of the women’s World Cup.
- Netflix Games has partnered with FIFA to launch a new football game on the platform.
- The expected growth in 2026 expenses is approximately 10%.
Netflix: An Overview of the Inception of This OTT Giant
Netflix is a media company based in Los Gatos that started as a video rental model. After a few years, the company introduced a personalized movie recommendation system. Using a specific algorithm, they personalize the movie recommendations. After Netflix’s prize contest, personalization improved with the help of 40,000 contestants.
In 2023, Netflix started live streaming with Chris Rock’s stand-up special. This livestream grabbed more opportunities in 2024, like a 10-year deal with World Wrestling Entertainment (WWE) and the announcement of the Mike Tyson vs Jack Paul boxing match.
Here is some award-winning original content by Netflix:
- KPop Demon Hunters: A top-viewed original fantasy-musical show.
- Frankenstein, All The Empty Rooms, The Singers: Top award-winners.
- The Residence: A highly-viewed series.
- House of Cards: 3 Primetime Emmy Awards
- Unbreakable Kimmy Schmidt
- Stranger Things: More than 100 international awards, including a Screen Actors Guild Award
A Quick Look – Netflix Statistics
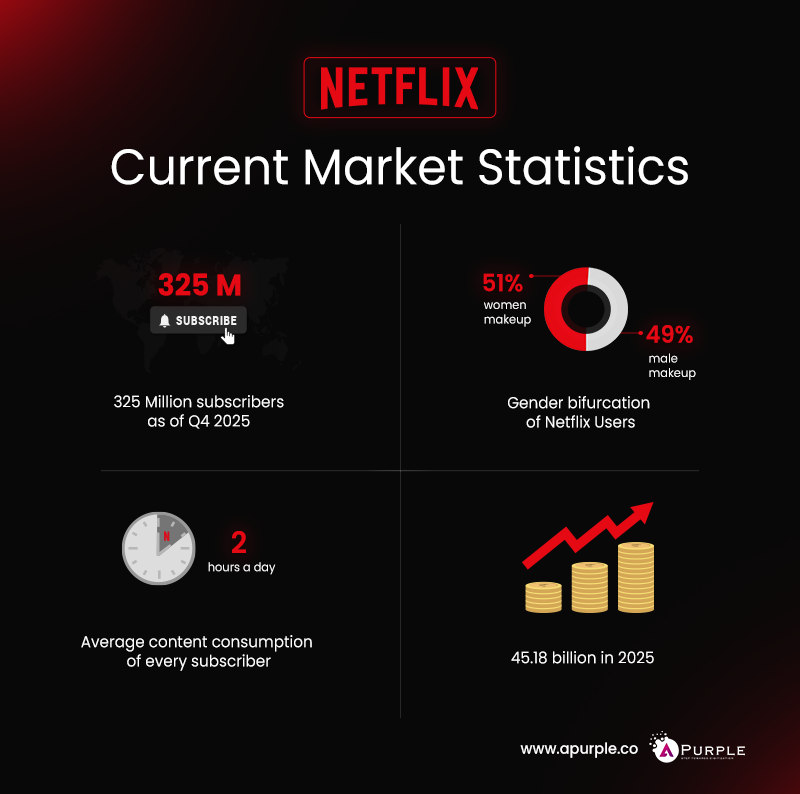
- According to the recent 2025 reports, there are 325 million subscribers worldwide. This number had considerably risen since 2024, when this OTT giant had 300 million subscribers.
- According to reports, Netflix generated USD 12.05 billion in revenue in the last quarter of 2025. Also, the revenue of 2025 was around USD 45.18 billion.
- Netflix currently has a vast market spread in 190 countries worldwide.
- Netflix is preferred by the United States over 66.7 million other streaming platforms.
- Regarding Netflix users’ gender bifurcation, 49% are male users, and 51% are female users.
- Overall, 65% of users are from outside the USA & Canada.
- On average, these OTT giant customers spend around 2 hours each day consuming Netflix content.
- Netflix has captured the Giant market in Europe, the Middle East & Africa.
- Netflix is currently used by around 44% of streaming service customers.
Comprehensive Understanding of Netflix Statistics Through Multiple Parameters
These parameters about Netflix will help in understanding its functions, where its position as per the current OTT market, its revenue, demographics, etc., of this entertainment giant that is leaping ahead of its competitors:
Analysis of the Netflix Subscriber Growth
Over the years, the number of Netflix subscribers has increased. If we take on the last decade, then we can conclude that Netflix is the preference of customers over any other OTT platform:
Netflix’s Subscribers Count Over The Last Decade
Netflix saw a brief slowdown at the start of 2022, going against expectations of steady growth. In fact, it lost around 1.17 million subscribers in the first half of the year — its first noticeable dip in years.
But the setback didn’t last long.
By 2023, Netflix had recovered strongly, crossing 260 million subscribers. The growth continued through 2024 and 2025, reaching an estimated 325 million subscribers — showing steady momentum despite increasing competition in the streaming space.
In the table below, you can see how Netflix’s subscriber base has grown over the past decade:
| Year | Netflix Subscribers Count |
|---|---|
| 2019 | 151.5 million |
| 2020 | 192.9 million |
| 2021 | 219.7 million |
| 2022 | 230.7 million |
| 2023 | 260.28 million |
| 2024 | 300 million |
| 2025 | 325 million |
Netflix Subscribers by Region
If we see the subscriber count of Netflix per region, then as per the 3rd quarter of 2024, Europe, the Middle East & Africa have the highest number of paying subscribers, 96.13 million. This table describes the exact counts of the top countries with the highest Netflix subscribers:
| Region | Netflix Subscribers Count |
|---|---|
| Europe, Middle East & Africa | 101.13 million |
| USA & Canada | 89.63 million |
| Latin America | 53.33 million |
| Asia Pacific | 57.54 million |
The number reveals that Netflix earns heavily from Europe, the Middle East, and Africa. But did you know that Netflix is also pushing towards creating region-based content? It has already started funding local creators to produce regional movies and web series, positively impacting Netflix’s earnings.
Netflix Revenue of The Last Decade from 2013 to 2025
However, one thing to note is that Netflix is mainly consumed through the app (mobile and smart TV). For this reason, many SVOD startups are looking for a Netflix app, which helps with budgeting without compromising on quality.
But how much does Netflix make a year? Here is how much Netflix has earned in the past decade, from 2019 to 2025:
| Year | Netflix Revenue Earnings(In Billion) |
|---|---|
| 2019 | USD 20.15 B |
| 2020 | USD 24.99 B |
| 2021 | USD 29.70 B |
| 2022 | USD 31.61 B |
| 2023 | USD 33.724 B |
| 2024 | USD 39 B |
| 2025 | USD 45.18 B |
Netflix Revenue Statistics Based On Age And Gender
Age is a significant factor in media streaming websites. You will rarely see content for children on these subscription-based streaming websites. The reason is that the teenage group, although it consumes content heavily, doesn’t earn and cannot afford the subscription. Some parents subscribe to services for their children, but the number is low. Here is how its subscribers are divided based on the age factor.
Based on the US subscriber base, the 18-29 age group is the biggest consumer of Netflix, whereas the 65+ age group is the smallest.
The gender ratio is neck-to-neck. 49% of its subscribers are male, while 51% are female.
The average Netflix subscriber is a millennial, and mostly Netflix members are some college students or have a bachelor’s degree or more.
Netflix Revenue Prediction for 2026
- Netflix forecasts USD 50.7B – USD 51.7B in revenue in 2026, which is higher than the previous year.
- The revenue growth will be driven by paid memberships and per member.
- Netflix targets 31.5% operating margin in year 2026.
- Netflix forecasts growth of 93.5 million subscribers by 2029 in North America and 70.1 million in the Asia Pacific.
Netflix Business Model – How it Earns Revenue and Spends it
Netflix is currently the top SVOD (Subscription-based Video on Demand) platform. YouTube has recently started to come up with YouTube Red. However, it is rarely known among those who currently have the chant of ‘Netflix and chill.’ When Netflix was founded in 1997, it aimed to provide DVDs through the mail. The business idea was to provide subscription-based DVD rentals. And it worked. People loved the idea and started renting at 50 cents each. Later, the subscription model was changed in 1999. The company offered a monthly subscription of USD 15.95 for four monthly movies with no return date. Netflix statistics from this time revealed that the company had managed to list 5,200 titles in its catalog by 2000.
Here, the company earns in three ways:
- Domestic streaming
- International streaming
- DVD rentals
Netflix’s subscription rates are divided into three tiers: Basic, Standard, and Premium. Founded in 1997, Netflix’s initial segment was DVD rental. However, in 2007, considering the world’s lean toward the internet and its potential, it shifted toward OTT. Interestingly, as of 2019, Netflix had a DVD rental subscriber base of 2.15 million. Netflix’s revenue and income ultimately come from subscriptions.
In 2019, when Covid proved fatal for the world, it brought a boon for Netflix. Its revenue suddenly grew from USD 1.86 billion in 2019 to USD 2.76 billion in 2020. The number further exploded to USD 5.1 billion in 2021. The company is projected to grow even after facing a 200,000 decline in subscribers for the first time in a decade.
It produces an enormous number of Netflix original titles. Currently, in 2026, Netflix Acquired Warner Bros, including its film and television studios, HBO Max, and HBO. This brings two pioneering entertainment businesses together. Franchises and movies like The Big Bang Theory, The Sopranos, Game of Thrones, The Wizard of Oz, and the DC Universe will join Netflix’s extensive portfolio.
Where Is Netflix Going From 2025 To 2027?

Recently, Netflix has faced massive competition from other Video Streaming Apps like Amazon, Hulu, HBO, Disney, Hotstar, Warner Bros, etc. When large players like Disney, Warner Bros, etc. pull out, the quality of content suffers.
People love seeing Disney movies. Consequently, this pulls away a chunk of subscribers, too. However, Netflix is trying to release many original titles to fill the space, and the statistics confirm it. But then Amazon is giving it a brutal competition.
However, Netflix holds the top position by releasing more than 700+ new titles. Moreover, the entertainment industry has enormous potential with the advent of new VR, AR, and AI technologies. Statistics reveal that companies are investing billions in creating an immersive experience for viewers, considering the future of entertainment.
However, Reed Hastings believes that VR could be unsustainable for television because of the sensations it creates. OTT platforms will rule the future of the tech-entertainment industry.
How Can aPurple Help You With Video Streaming Apps?
We hope this article has offered profound insights into Netflix statistics and why you should consider video streaming app development. Apps provide multiple benefits, making them an inviting option for businesses looking to reach a wider audience.
Our team works closely with you to understand your unique requirements, offering customized consulting and development services tailored to your needs. aPurple is your trusted partner for startup app development, from designing intuitive user interfaces to integrating essential features that engage your target audience.
If you need help, especially with hybrid entertainment, car rental, healthcare, eCommerce, or logistics businesses, aPurple is here to assist you. With more than five years of experience and 300+ successful projects delivered, our experts are adept at developing Hybrid Apps. Get customized app consulting services from our experts.
FAQs